HPLC-Tested Compounds: How to Read Purity and Impurity Data
HPLC-tested means a compound lot was run through high-performance liquid chromatography, which separates the sample into components and reports the share of the signal that belongs to the main peak. It is the standard way to measure chromatographic purity. The percentage alone does not tell you the compound’s identity, its net content or the nature of its impurities. This guide shows how to read a lot report so you can judge what the number covers.
It is written for researchers and lab buyers who order compounds for in vitro work and want to compare lot documentation like an analyst.
TL;DR
- HPLC purity is the main peak’s area divided by the total detected peak area, as a percentage. It describes one method under one set of detection conditions.
- Compound bonds absorb UV light, typically read at 210 to 220 nm. Anything that does not absorb there is not part of the purity figure.
- A high purity percentage does not prove identity. Mass spectrometry is the usual companion method for confirming what the main peak is.
- Impurity profiling looks at the small peaks, and most related impurities in synthetic compounds are deletion sequences. Method selectivity changes what you see.
- A useful lot report names the method, shows the chromatogram and is tied to the exact lot you received, along with how that lot was stored.
Table of Contents
- What HPLC testing means for a research compound
- What the purity percentage means
- How to read a chromatogram and a lot report
- Impurity profiling: what the small peaks tell you
- What HPLC cannot prove on its own
- Why storage belongs in the purity conversation
- Perspective
- A short checklist before you accept a lot
- Where to find lot-documented compounds
- FAQ
- Sources
What HPLC testing means for a research compound
High-performance liquid chromatography pushes a dissolved sample through a packed column under pressure. Different molecules interact with the column material differently, so they leave it at different times. A detector records each one as a peak on a chromatogram.
For compounds, several separation modes exist. A compound-focused academic review of HPLC analysis and purification covers size-exclusion, ion-exchange and reversed-phase chromatography, plus a mixed-mode hydrophilic interaction and cation-exchange approach. In routine quality control, reversed-phase HPLC (RP-HPLC) is the one you will meet most often. It separates mainly by hydrophobicity, and that suits compounds, which differ from their close relatives by only one or two residues.
Detection is usually by UV absorbance. The same review notes that compound bonds absorb UV light, which gives a general detection means, generally at 210 to 220 nm. That is why many reports list a wavelength such as 214 nm. At that wavelength the detector responds to the backbone of the compound, not to one particular side chain.
What the report is actually measuring
The sample is injected, the gradient runs, and the software integrates every peak. The main peak is the target compound, assuming it is. Smaller peaks are everything else the detector could see.
That is the first thing to hold on to: HPLC tells you how the detected material is distributed among peaks. It does not, by itself, say what each peak is.
What the purity percentage means
Chromatographic purity is calculated as the area of the target peak divided by the total area of all integrated peaks, multiplied by 100. A report that says 98.5% means that in this run, the main peak accounted for 98.5% of the integrated UV signal.
Three consequences follow from that definition.
- It is a ratio of what the detector sees. Because detection relies on compound-bond absorbance, components with no meaningful absorbance at the chosen wavelength do not enter the calculation. Water, salts and counter-ions left over from synthesis and purification are typical examples. This is why purity and net compound content are two different numbers, and why a figure for purity should not be used to calculate how many milligrams of active compound are in a vial.
- It depends on the method. Column chemistry, gradient shape, mobile phase and wavelength all influence which species separate and which hide under the main peak.
- It depends on integration. Where the baseline is drawn and which small peaks are counted can shift the result.
A reported purity is only fully interpretable when the method sits beside it. A number with no method, wavelength or chromatogram is a claim, not a dataset.
When a lower purity figure is a method effect
The literature gives a clear case. In a peer-reviewed evaluation of synthetic quorum sensing compounds, the compounds were ordered at a requested purity of at least 95.0%. The authors’ in-house chromatographic QC found that only 44.0% met that requirement. They also found that method selectivity and the suitability of the chromatographic system affected the purity results, and that supplier certificate values differed from in-house results obtained with different methods.
The lesson is not that any one supplier’s number is wrong. It is that the same material can give different percentages under different methods, so comparing two lots only makes sense when both come from comparable methods.
How to read a chromatogram and a lot report
A practical reading order saves time. Work through it every time you open a new report.
Step 1: Match the document to the lot
Check that the lot or batch number on the report matches the vial label and the shipping paperwork. A generic report for a product family is not lot-level data. The sample date, the analysis date and the lab that ran it should be on the page.
Step 2: Find the method line
Look for the column type, mobile phases, gradient, flow rate, temperature and detection wavelength. You do not need to reproduce the method, but you need to know it exists. A C18 column with an acidic aqueous and organic gradient and UV detection at 214 nm is a typical reversed-phase setup for compounds.
Step 3: Look at the chromatogram itself
The table of peak areas is a summary. The trace shows more:
- Baseline. A flat, quiet baseline makes small peaks easier to integrate honestly. A drifting baseline can hide or invent minor peaks.
- Main peak shape. A symmetrical peak is a good sign. A shoulder, a split top or a long tail can mean co-eluting species.
- Small peaks near the main peak. Related impurities tend to elute close to the target, because they differ from it by only a small change.
- Run length. The gradient should run long enough to bring strongly retained material off the column. A report whose trace stops early may leave late-eluting species out of the denominator.
Step 4: Read the peak table with the trace
Check the retention time of the main peak, its area percentage and the number of integrated minor peaks. If the report lists one peak at 99%, ask whether the gradient and wavelength would have shown the impurities you would expect from synthesis.
Step 5: Look for identity data
HPLC retention time does not establish identity. Look for mass spectrometry data, usually the observed molecular mass against the theoretical mass, on the same report or in a companion document. A 2015 implementation of online UPLC-UV/MS for routine QC describes how coupling a mass detector increased the information content, enabling direct identification of the main compounds and small impurities without reference standards.
Step 6: Check what else is in the lot record
Purity is one line of a quality record. Sterility testing, endotoxin where relevant, net compound content, appearance and storage conditions all matter to experimental reproducibility. For in vitro work, a report that covers several of these tells you more than a single percentage.
Impurity profiling: what the small peaks tell you
Impurity profiling moves attention from the main peak to everything around it. The questions change from how pure the lot is to what the contaminants are, how many there are and whether they would interfere with your assay.
Where compound impurities come from
Impurities arise during synthesis, purification and storage. A 2024 Journal of Compound Science paper developed a gradient RP-HPLC method to separate a decacompound from six related impurities and validated it following ICH guidelines. The point of that kind of work is that impurities can come from several pathways, so a stability-indicating, validated method with good separation is needed to monitor related substances reliably.
For solid-phase synthesis, common related impurities include sequences missing one or more residues, sequences with an extra residue, and modified forms of the target. The quorum sensing study reported that most related impurities were compounds lacking amino acids from the desired sequence. Its MS1 and MS2 spectra were used to identify related impurities, including deletions and insertions.
How impurities are identified
UV traces show that an impurity exists and roughly how much of the signal it holds. Identification takes a second dimension of information:
- Accurate mass (MS1). The measured mass differs from the target by a pattern that points to a specific change, such as a missing residue.
- Fragmentation (MS2). Fragment ions place the change within the sequence.
- Orthogonal separation. Running a second chromatographic mode with different selectivity can split species that co-elute in the first.
A 2021 PubMed-indexed review of LC-MS characterization of synthetic compound therapeutics states that MS can be used to characterize impurities, and discusses pitfalls in doing so.
Reading your own report against this
A lot report that shows the main peak and a short list of minor peaks is a snapshot. If your assay is sensitive to a particular modification, for example one that changes receptor binding in a cell model, ask whether the method could have separated it from the main peak at all. That is a fair analytical question, and it is the reason we publish lot documentation with each order.
What HPLC cannot prove on its own
HPLC is the right tool for purity. It is a partial tool for identity. Knowing the limits lets you pair it with the right companion data.
| Question | HPLC-UV answers it? | What completes the picture |
|---|---|---|
| What share of detected UV signal is the main peak? | Yes | Method and wavelength stated on the report |
| Is the main peak the named compound? | No, not alone | Mass spectrometry, observed against theoretical mass |
| What are the minor peaks? | Only that they exist | MS1 and MS2 spectra, orthogonal separation |
| How much compound is in the vial by weight? | No | Net compound content measurement |
| Is the lot sterile? | No | Separate sterility testing |
| Has the material changed since testing? | No | Storage and temperature records |
The quorum sensing authors made the identity point sharply: even purified synthetic compounds can contain a considerable amount and wide variety of related impurities, and the main chromatogram peak could in principle be an impurity instead of the requested compound. Their conclusion was to characterize in-house.
Co-elution and method performance
Some species hide under the main peak. The same MS-coupled QC paper describes how an averagely performing HPLC-UV method combined with inadequate integration could lead to a falsely low quality conclusion, while better separation in the UPLC-UV/MS method changed the measured impurity amount and let MS confirm identities. Method quality cuts both ways: weak separation can understate or misattribute impurities.
Transferring methods between systems
If your lab re-runs a lot on its own instrument, expect some variation. A 2026 study on moving compound methods between HPLC and FPLC systems notes that column geometry, gradient formation and mobile-phase chemistry differ between systems. After applying a correction equation, the authors reduced transfer errors in elution percentage from about 17% to under 5%. Retention times will not match exactly between instruments, and a good method description helps you map one system onto another.
Why storage belongs in the purity conversation
A purity figure describes the sample on the day it was analyzed. What happens afterward is a separate matter. Impurities can also arise during storage, which is part of why validated methods are described as stability-indicating. A lot that tested well at release but sat at an uncontrolled temperature in transit is a different material from the one on the report.
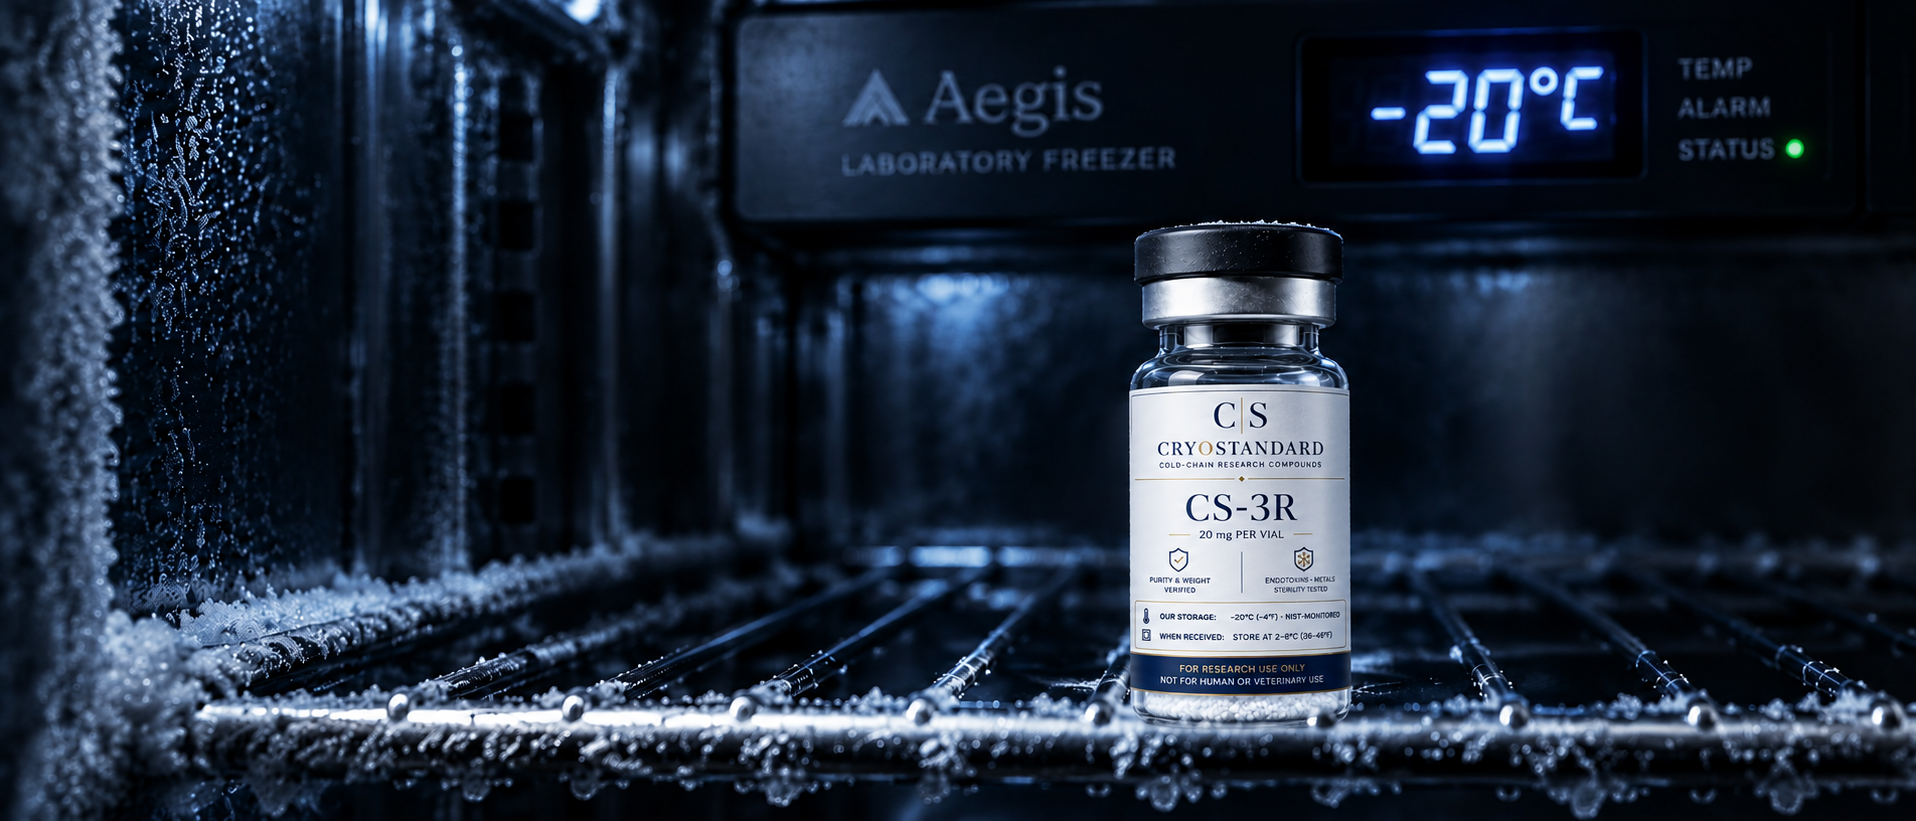
This is the reason we treat testing and temperature as one system. Our cold-chain standard holds research compounds at a consistent −20°C with continuous NIST-traceable monitoring, and storage and temperature records accompany each order. A lab can then read the purity result and the handling history together.
Perspective
We think the purity percentage is the least interesting number on a compound report, and the most over-quoted. What makes a lot trustworthy to us is the chain around it: a lot-specific result, a stated method, third-party analytics, and a temperature record showing that the vial you open is the material that was tested.
That is why we designed CryoStandard around cold-chain handling. Our approach is to hold materials at −20°C under continuous NIST-traceable monitoring, test each lot for purity and sterility, and send detailed certificates of analysis with storage records. Researchers who work in vitro already control their cell lines, buffers and incubators. We think the compound should get the same discipline.
Our materials are for qualified researchers and laboratories, strictly for in vitro and laboratory research, never for human or veterinary use. Reducing variability starts at the supplier, and we build for that.
Animal
A short checklist before you accept a lot
- The lot number on the report matches the vial.
- The method is described: column, gradient, wavelength.
- The full chromatogram is shown, not only a percentage.
- Identity is supported by mass data, not by retention time alone.
- Purity is not confused with net compound content when you calculate concentrations.
- Sterility and storage records exist for the lot.
- You record the lot number in your lab notebook with every experiment, so a surprising result can be traced.
Point 7 is cheap and repays itself. When a run misbehaves, lot-level traceability turns a vague suspicion about the compound into a checkable comparison with the previous lot.
Where to find lot-documented compounds
If you are sourcing for in vitro work and want documentation you can read like the checklist above, start with our quality and testing page, which explains how third-party COAs fit into each lot. Product pages such as GHK-Cu 50 carry a specification and COA, and the full research compounds catalog lists what is available to verified laboratories and institutional buyers. Tiered pricing applies to institutional and bulk orders.
We supply qualified researchers and laboratories only, and all products are for in vitro and laboratory research use.
FAQ
What does HPLC tested mean on a compound label?
It means a sample of the lot was analyzed by high-performance liquid chromatography and the main peak’s share of total detected signal was reported as purity. The label alone does not say which method, wavelength or lab was used. The lot report should.
Is 99% HPLC purity the same as 99% compound in the vial?
No. Purity is a ratio of peak areas among species the detector sees, mostly through compound-bond absorbance around 210 to 220 nm. Water, counter-ions and salts are not part of that ratio, so net compound content is a separate measurement.
Does HPLC confirm that the compound is what the label says?
Not by itself. Retention time suggests consistency, but identity is confirmed with mass spectrometry, which compares observed mass to the theoretical mass. Peer-reviewed work on synthetic compounds stresses that the main peak should not be assumed to be the target without such data.
Why do two labs report different purity for the same compound?
Column chemistry, gradient, mobile phase, detection settings and integration choices all change which species separate and how peaks are counted. A study of synthetic compounds found supplier certificate values differing from in-house results obtained with different methods. Compare lots using comparable methods.
What should I check on a certificate of analysis first?
Start with the lot number, then the method description and the chromatogram. After that look for mass data for identity, sterility results and storage records. Together these show whether the number on the page describes the material in your freezer.
Sources
- HPLC Analysis and Purification of Compounds (PMC, 2007)
- Quality evaluation of synthetic quorum sensing compounds (2015)
- Implementation of a single quad MS detector in routine QC (PMC)
- A stability-indicating method development and validation, Journal of Compound Science (2024)
- Characterization of Synthetic Compound Therapeutics Using LC-MS (PubMed, 2021)
- Improvement of Analysis and Transferability in Compound chromatography (PMC, 2026)